Short Tutorial
This short tutorial will give you a fast step-by-step introduction to MapAnalyst. Before you start, please download and decompress the latest version of MapAnalyst and the sample data set.
Note: this is a tutorial for an older version of MapAnalyst that did not include OpenStreetMap.
Importing Maps
Start by importing the old map. Select File – Import Old Map Image and choose the old map of the sample data set in the file named "old_map.jpg".
Then import the new reference map with File – Import New Map Image and choose the new map named "new_map.png".
Adding Control Points
Start identifying identical places on the old map and the new reference map. For example, the two screenshots show a control point set on the bridge in Basel (upper left corner of the maps).
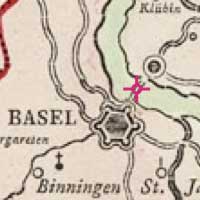
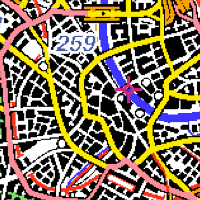
To add a control point, select the central button of the three left-most buttons, and click in the map. Add a point to the old map and a corresponding point in the new reference map. Then click the Link Points button to link the two points (lower part of the window), and give the linked points a name. Note that the Link Points button is only active if the old and the new map each contain exactly one selected point. To select or deselect a point, use the left-most tool. To move a point, first select it, then move it with the third tool. To delete a point, first select it, then choose Edit - Delete.
Repeat adding a series of point pairs – or import a set of predefined points to shorten the tutorial: select Points – Import Point List and then choose the file "points.txt".
Note: the points in the modern reference map will appear at a wrong location when you use the OpenStreetMap. In this case, replace the OpenStreetMap by importing the new reference map, as described above.
Computing a Distortion Grid
After adding and linking a series of corresponding points, press the Compute button (at the top left of the window) to generate a distortion grid or other types of visualizations. Use the lower left part of the window to configure the different visualization methods.
Exporting the Results
Use File – Export Old Map Graphics to export the visualizations. Select the SVG or the WMF format if you intend to edit the visualizations in a graphics software. Use the DXF or the Ungenerate format for use in a CAD or GIS application. Choose PNG or JPEG for use in other software packages.
Saving the Work
Use File – Save Project to save your work to a file that can be reopened by selecting File – Open Project.