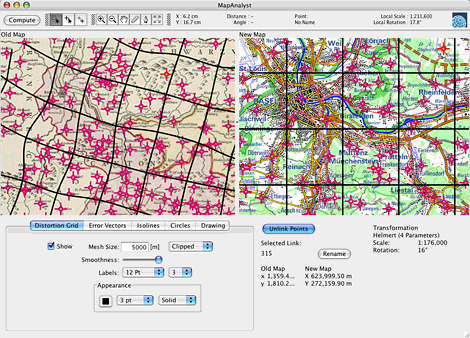
Screenshot
MapAnalyst's main window is vertically divided into two sections: the left side of the window shows the old map to be analyzed, while the right side shows a modern reference map. The red crosses on both maps are control points – each point on the old map is linked to a corresponding point on the new map.

In the lower part of the window you can customize the analysis parameters. The lower left section consists of interface elements for configuring the different accuracy visualizations. The lower right part allows for linking pairs of control points, and shows the computed scale and rotation of the old map.
The screenshot shows MapAnalyst running on Mac OS X. Please note that MapAnalyst also runs on Windows, and Linux.